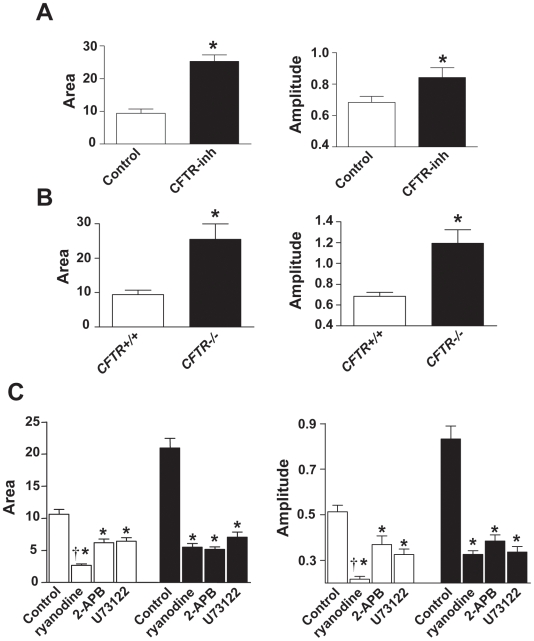
Figure 4. Quantification and inhibition of SR–mediated calcium release.
(A) Group mean data for intracellular Ca2+ responses in Cftr+/+ myotubes, either without (control) or with (CFTRinh) pre-treatment by CFTR-inh172. (B) Group mean data for intracellular Ca2+ responses in Cftr+/+ versus Cftr −/− myotubes. (C) Effects of inhibiting RyR or IP3R function in Cftr+/+ (open bars) and Cftr −/− (filled bars) myotubes. For all experiments, N = minimum of 30 myotubes per group. * p<0.05 versus control, † p<0.05 for ryanodine versus 2-APB and U73122.

