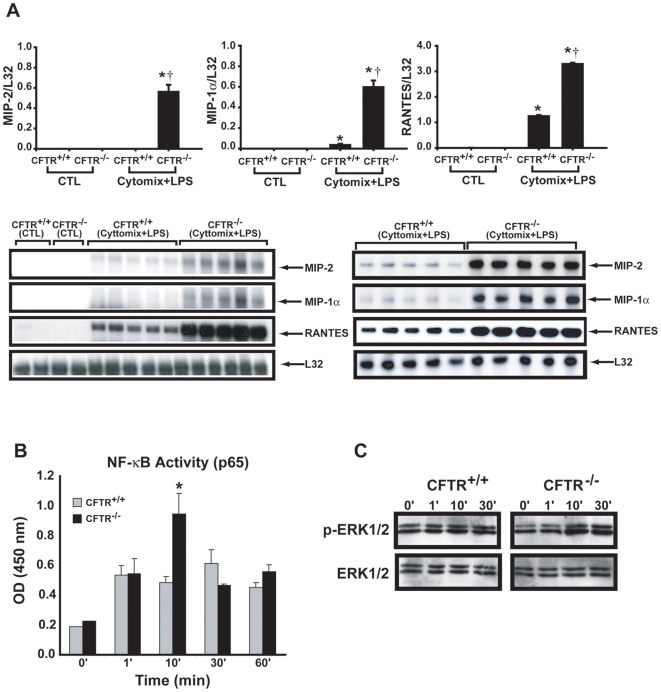
Figure 5. Hyperinflammatory phenotype of Cftr−/− skeletal muscle cells in vitro.
(A) Upper panels: Cytokine mRNA expression levels in Cftr+/+ versus Cftr −/− diaphragmatic myotubes under control conditions (CTL) and after 4 hours of stimulation (TNF-α 1 ng/ml, IL-1α 5 U/ml, IFN-γ 20 U/m, LPS 1 ng/ml). N = 5 per group; * p<0.05 for control versus stimulated groups, † p<0.05 for Cftr+/+ versus Cftr −/−. Lower panels: Representative RNase protection assays from diaphragm (left panel) and limb muscle (right panel). (B) NFκB p65 levels in nuclear extracts (normalized for protein) obtained from diaphragmatic myotubes in Cftr+/+ versus Cftr −/− groups stimulated for the indicated time periods (0–60 min). N = 4–5 per group; * p<0.05 for Cftr+/+ versus Cftr −/−. (C) Western analysis of phosphorylated (pERK1/2) and total ERK1/2 MAPK in cytoplasmic lysates from Cftr+/+ and Cftr −/− diaphragmatic myotubes following stimulation with cytokines+LPS. Results are representative of 2 experiments.

