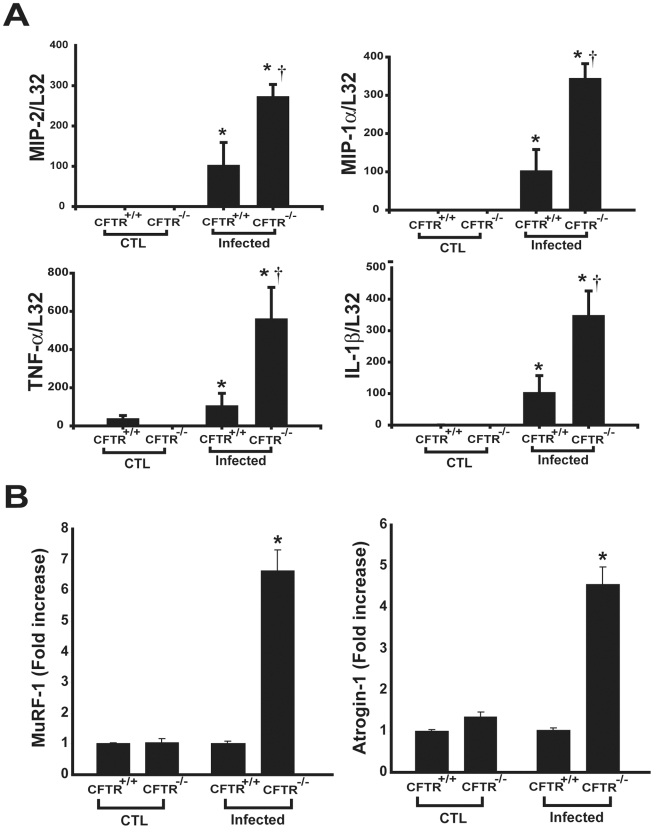
Figure 6. Hyperinflammatory phenotype of Cftr−/− skeletal muscle in vivo.
(A) Cytokine mRNA expression levels in Cftr+/+ versus Cftr −/− diaphragms for uninfected (CTL) and Pseudomonas-infected (day 2) mice. N = 4–5 mice per group; * p<0.05 for control versus infected mice, † p<0.05 for Cftr+/+ versus Cftr −/−. (B) Real-time PCR quantification of the E3 ubiquitin ligases MuRF-1 and atrogin-1 in diaphragms of control and infected mice. * p<0.05 for Cftr+/+ versus Cftr −/−.

