
Figure 5. Cortactin promotes serum-independent and anchorage-independent growth.
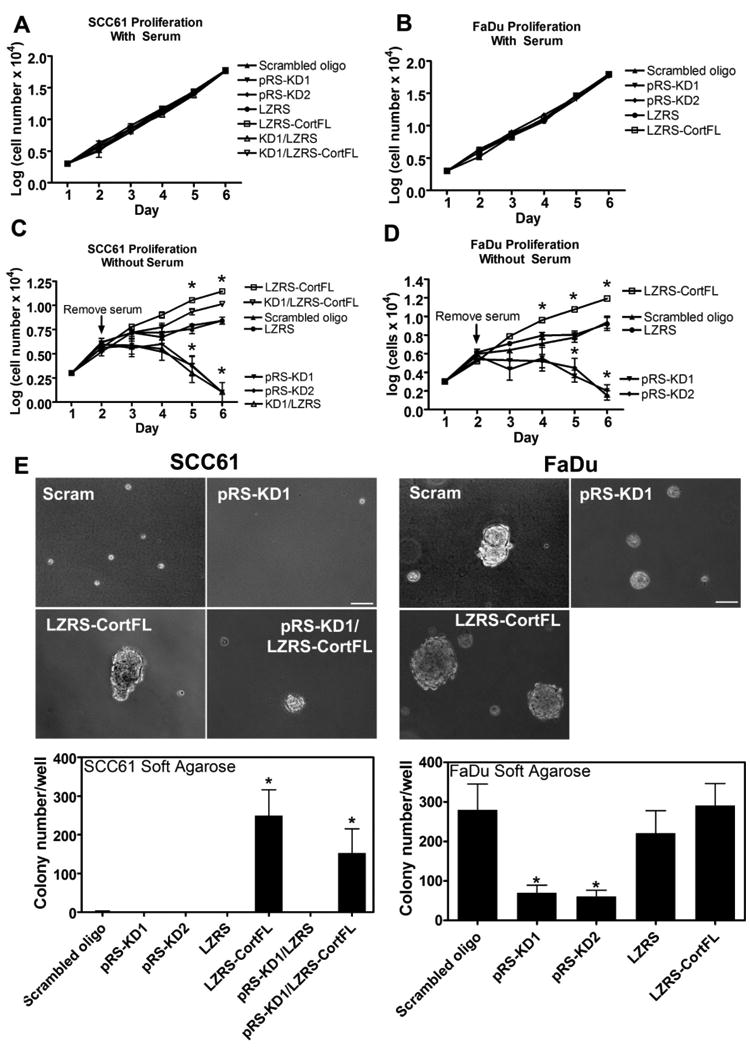
Culture of cortactin-manipulated SCC61 and FaDu cells demonstrates that cortactin has no effect on the growth of these cells in their full growth media. However, removal of serum leads to exquisite sensitivity of cell growth to the level of cortactin expression. SCC61 (A and C) or FaDu (B and D) cells were cultured in the presence (A and B) or absence (C and D) of 20% serum in DMEM in triplicate wells of a 24-well plate before trypsinization and counting on the indicated days. Note that for C and D serum was removed and cells were washed into DMEM on day 2. Shown is the combined data from three independent experiments. Each cortactin-manipulated cell line is indicated in the legend to the right of each graph. Data are represented as mean ± SEM of the log of the cell number. E. To test the role of cortactin in anchorage-independent growth, cortactin-manipulated SCC61 and FaDu cells were cultured for four weeks in 0.35% (soft) agarose in full growth media. Upper panel: Representative images from 4-week cultures. Note that for the less aggressive SCC61 cells, control cells did not form colonies but persisted as single cells. Cort-KD cells (pRS-KD1) were mostly absent from the cultures, suggesting apoptotic death. Cort-OE (LZRS-CortFL) and KD/rescue cells (pRS-KD1/LZRS-CortFL) both formed colonies. For the FaDu cells, all cell lines formed colonies but the size and number correlates with cortactin expressin levels. Scale bar = 100 μm. Graphs: Quantitation of colony number per well. Colonies were defined as cellular structures that were ≥100 μm in diameter. Data are represented as mean ± SEM and are from ≥3 independent trials for each cell line. Asterisks indicate p<0.05 compared to scrambled cortactin oligo control.