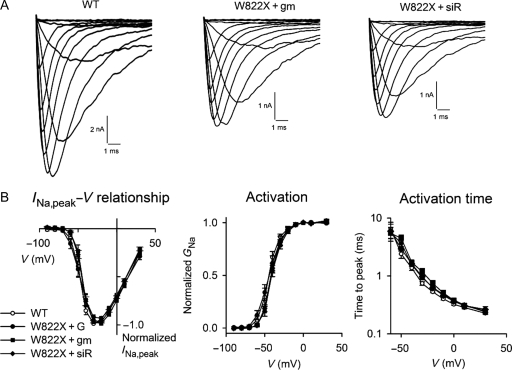
Figure 3.
Activation kinetics of Na+ channels. (A) INa of wild-type and W822X channels. The expression of W822X channels was elevated by exposure to gentamicin and siRNA against eRF3a. (B) INa,peak−V relationship (left panels), voltage dependence of activation (centre panels), and voltage dependence of the time to peak (right panels) for wild-type and mutant channels. INa,peak was normalized to maximal INa in order to compare the voltage dependence. Labels are the same as for Figure 1.

