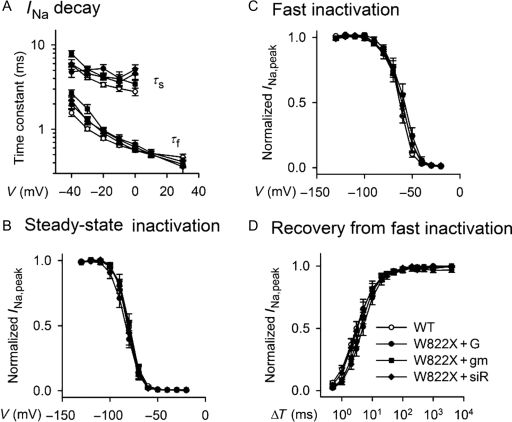
Figure 4.
Inactivation and recovery kinetics of Na+ channels. (A) Voltage dependence of fast and slow time constants of INa decay. The time constants were obtained by fitting the decay portions of INa in response to the voltage protocol in the inset of Figure 1B with a two-exponential function, Af×exp(−t/τf)+As×exp(−t/τs)+offset, where t is time and τf and τs are fast and slow time constants, respectively. (B and C) Steady-state and fast inactivation, respectively. (D) Kinetics of Na+ channel recovery from fast inactivation. The peak INa elicited by a test pulse in the voltage protocols depicted in the left panels was plotted against the voltage (V) of the conditioning pulse that preceded the test pulse. Labels are the same as for Figure 1.

