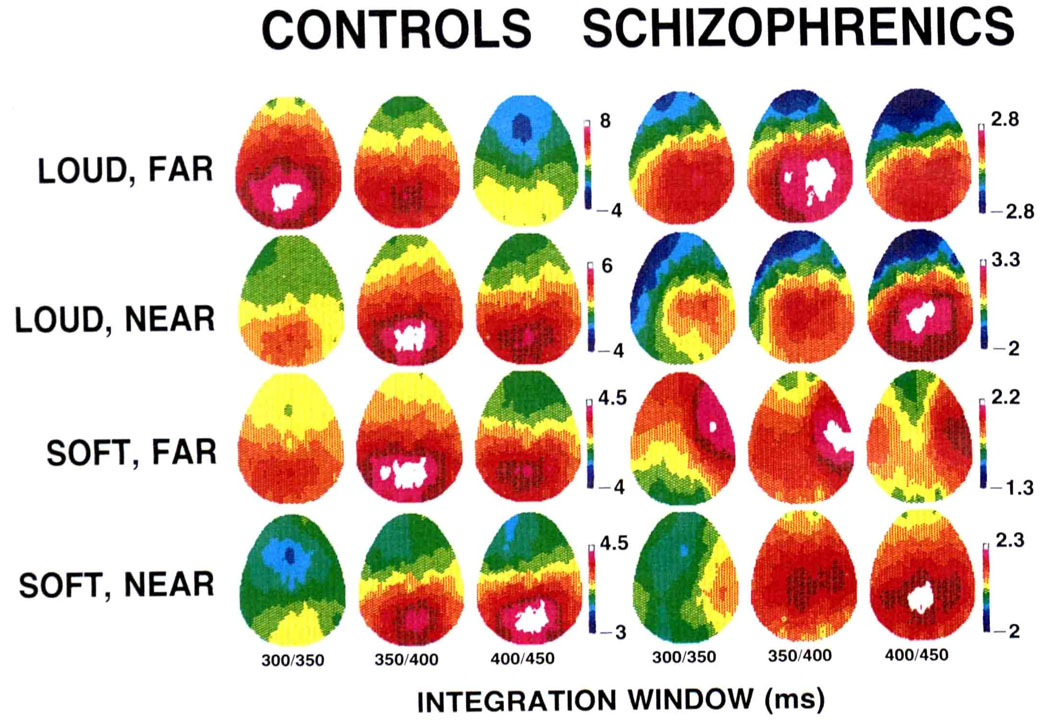
Figure 2.
Color-coded voltage maps derived from the full set of 28 electrodes for each group and each condition. Voltages are scaled relatively for each group and condition such that maximum voltage is white and minimum is blue so as to preserve topographic Information (refer to Figure 1 for absolute amplitudes).

