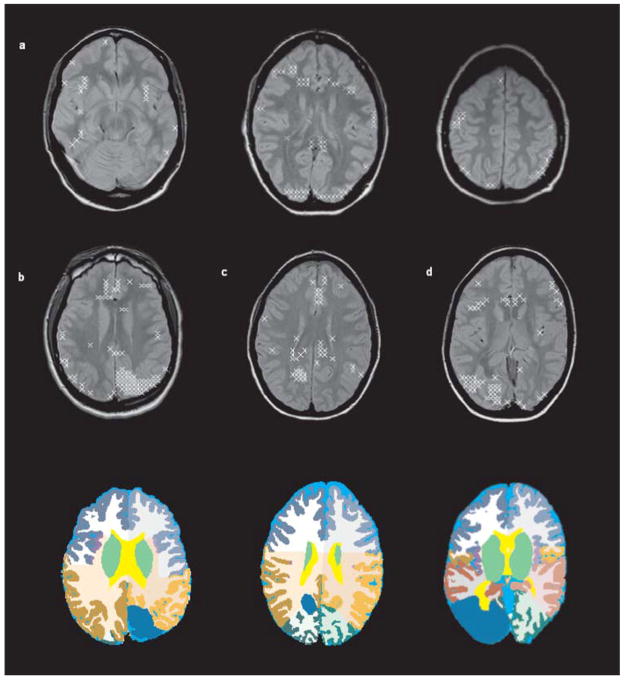
Fig. 4.
(a) Abnormality map, i.e., spatial distribution of all voxels outside one or several of the five different 95 % prediction intervals (NAA, Cr, Cho, NAA/Cr, NAA/Cho) in a control. The distribution of those voxels is rather diffuse. (b) Abnormality map for patient No1 and below, region of the malformation indicated in blue in the left parietal lobe on the segmentation image. As can be seen, abnormal voxels tend to cluster in the region of the malformation. (c) Abnormality map with corresponding segmentation slice for patient No 7 and (d) for patient No 5

