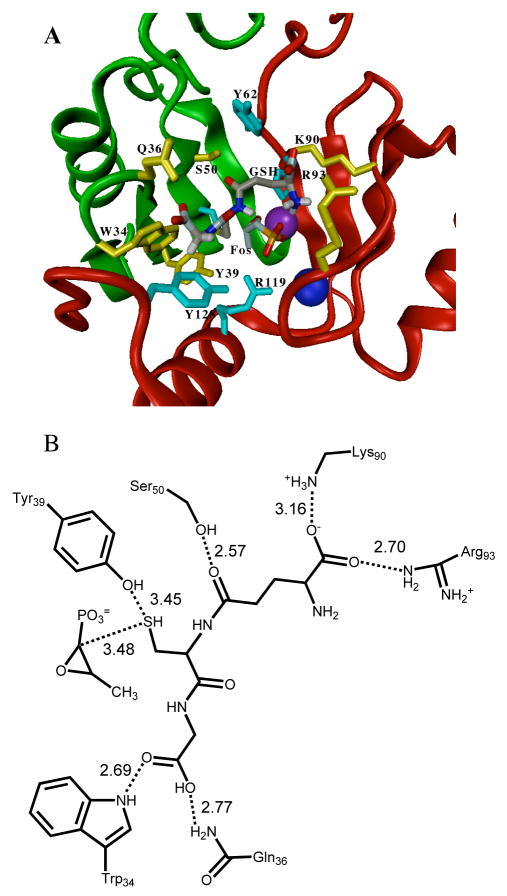
Figure 1.
A. Ribbon diagram of FosAPA with GSH shown in the docked position (Mn(II) in purple and K+ in dark blue). Residues that contribute electrostatic or hydrogen bonding interactions with GSH are shown in yellow while residues that are in van der Waals contact are shown in light blue. B. Diagram of residues participating in potential hydrogen-bonding or electrostatic interactions with GSH. The numbers represent the distances in Å. The position of the thiol group of GSH relative to Y39 and fosfomycin C1 is indicated. The distance between sulfur of GSH and C1 of fosfomycin is 3.5 Å, which is a favorable van der Walls contact.

