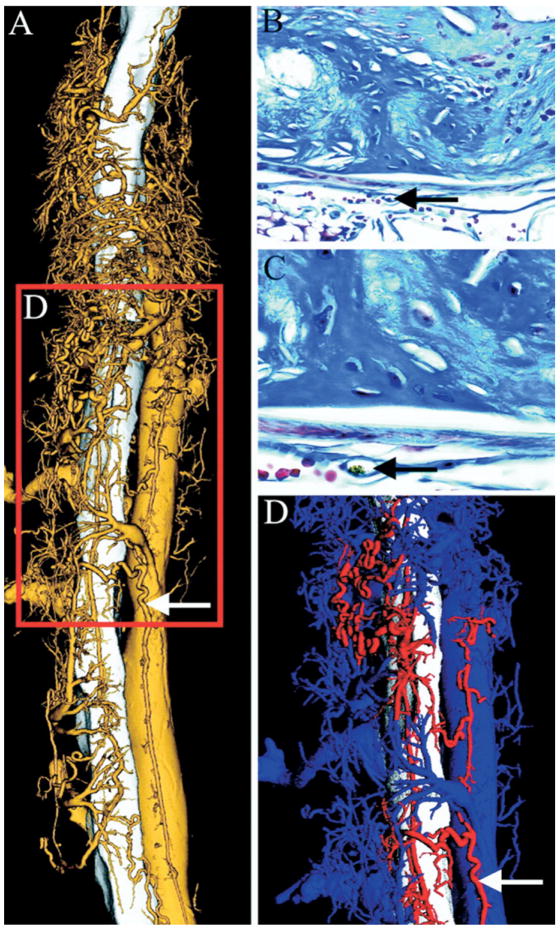
FIG 4.
Volume-rendered high-resolution microscopic CT image of the descending aorta, vasa vasorum (VV), and the inferior vena cava. (A) Demonstration of the 3D relationship of the VV (gold) to the aorta (white) (5-μm cubic voxels). (B and C) Corresponding histologic cross-sections of atherosclerotic lesions in the inferior vena cava with VV (black arrow) (Masson’s trichrome stain, original magnification ×40 [B] and ×100 [C]). (D) Arterial (red) and venous (blue) VV differentiated by false color. (Reprinted with permission from Langheinrich AC, Michniewicz A, Sedding DG, et al. Correlation of Vasa vasorum neovascularization and plaque progression in aortas of apolipoprotein E(−/−)/low-density lipoprotein(−/−) double knockout mice. Arterioscler Thromb Vasc Biol 2006;26:347–52.)

