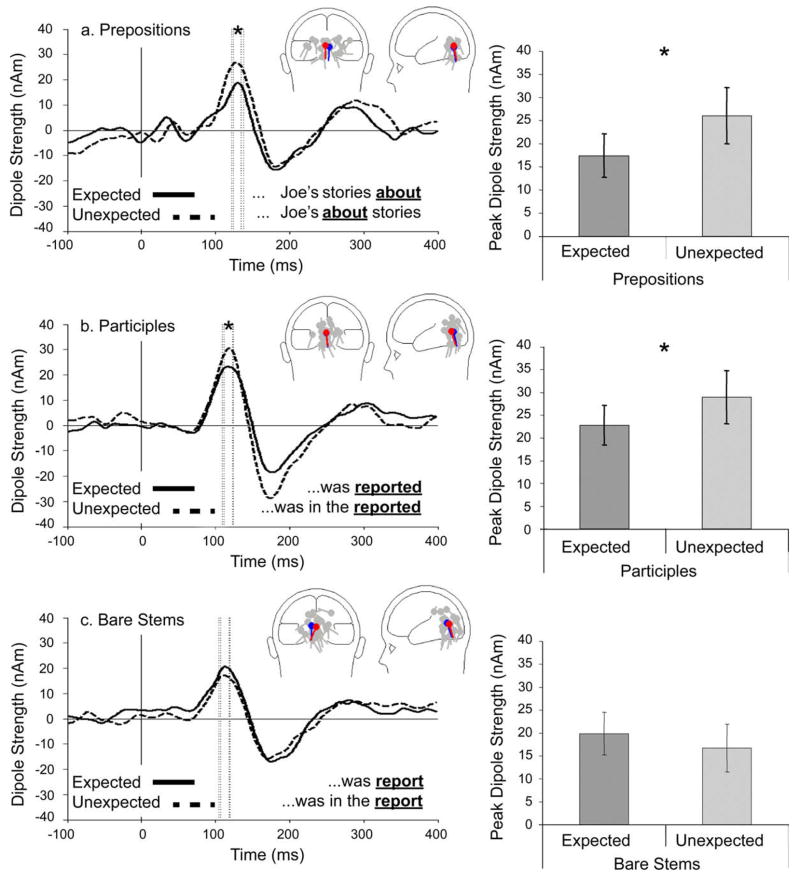
Fig. 2.
Grandaveraged waveforms for the M100 dipole sources per comparison (n = 11) and mean amplitudes in nAm for the 15 ms intervals centered around the M100 peaks (the time-window between the dotted lines in the waveform graphs). Mean dipole locations and orientations (blue = expected/red = unexpected) as well as the dipoles from the individual participants (grey) are plotted for each category. Results reveal effects of expectedness on M100 amplitude, but only for the Prepositions and Participles (* = p < .05). (For interpretation of the references to colour in this figure legend, the reader is referred to the web version of this article.)

