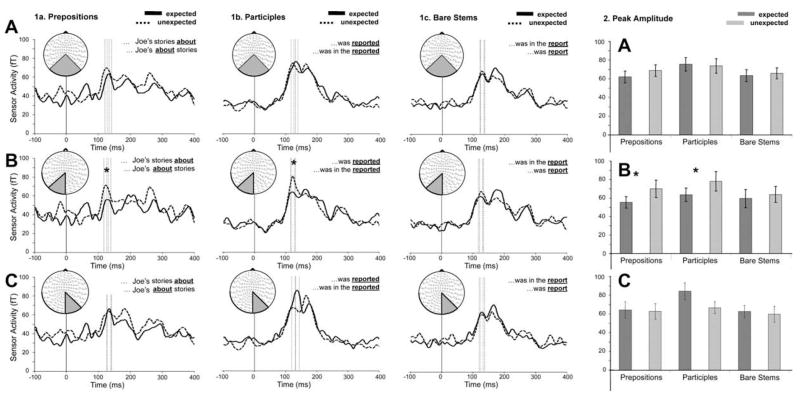
Fig. 4.
Left to right: Grandaveraged RMS’s per condition and mean amplitudes in fT for the 15 ms intervals of interest (indicated by the dotted lines in the RMS waveform graphs). The three regions of interest (ROIs), top to bottom: The two posterior octants combined (A), the left posterior octant (B), and the right posterior octant (C). ROIs are highlighted in sensor space. Results reveal reliably enhanced activity for the unexpected conditions in the left posterior ROI only (* = p < .05; n = 13).

