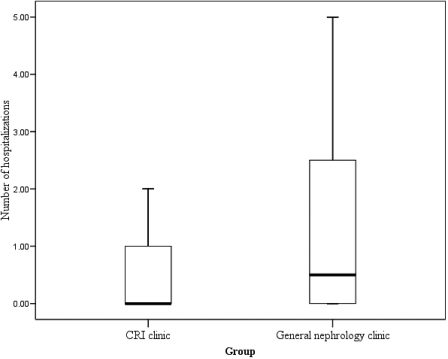
Figure 2.
Box plot of difference in the number of hospitalizations between the general nephrology and CRI clinic groups. The mean number of admissions was significantly higher in the patients from the general nephrology clinic (P < 0.05). The center line in the box indicates the median; the top and bottom of the box, quartile boundaries; vertical bars, minimum and maximum values within 1.5 times the interquartile range of the quartile boundary.

