
Figure 6. IR84a mis-expression confers novel olfactory sensitivity to phenylacetaldehyde.
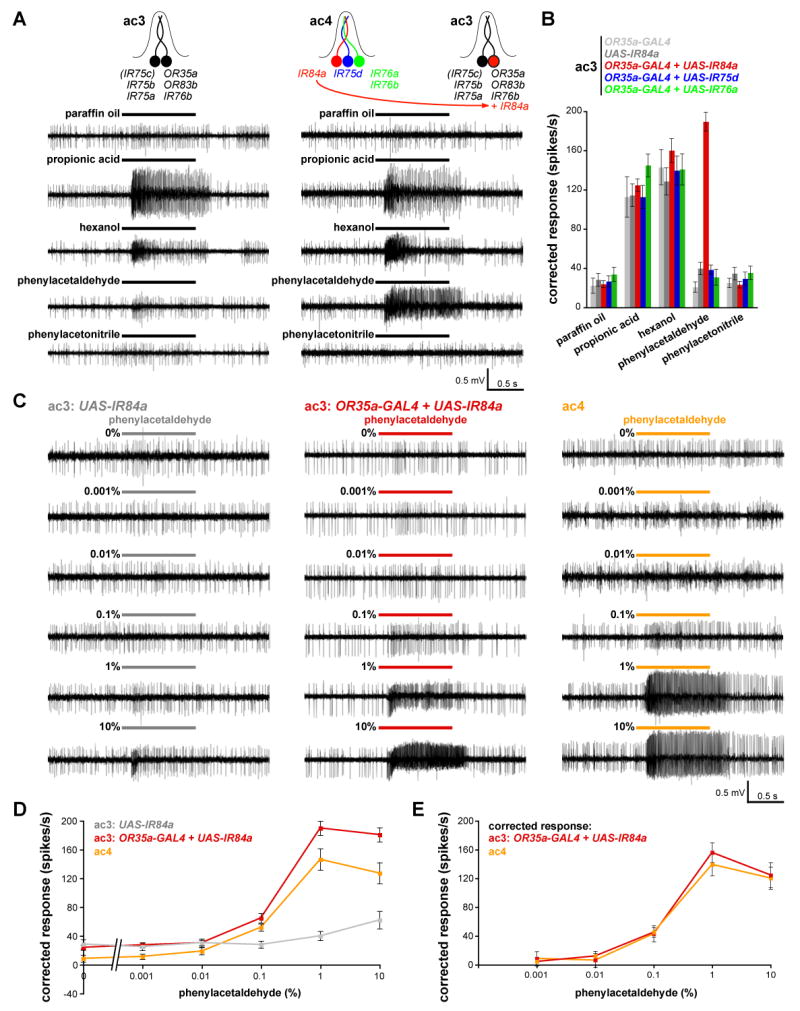
(A) Representative traces of extracellular recordings of neuronal responses to the indicated stimuli in control ac3 sensilla (UAS-IR84a/+) (left) and in ac3 sensilla in which IR84a is mis-expressed in OR35a neurons (UAS-IR84a/+;OR35a-GAL4/+) (right). Bars above the traces mark stimulus time (1 s). For these experiments, all odors were used at 1% concentration except for hexanol, which was diluted to 0.001%.
(B) Quantification of mean odor responses (± s.e.m; n=8-16, male flies) of the five indicated genotypes (OR35a-GAL4/+ (light grey); UAS-IR84a/+ (dark grey); UAS-IR84a/+;OR35a-GAL4/+ (red); UAS-IR76a/+;OR35a-GAL4/+) (green); UAS-IR75d/+;OR35a-GAL4/+) (blue) to the indicated stimuli [concentrations as described in (A)]). Responses of ac3 sensilla neurons to paraffin oil, propionic acid, hexanol and phenylacetonitrile are not significantly different between genotypes (ANOVA; p>0.1657) whereas responses to phenylacetaldehyde are significantly different in sensilla ectopically expressing IR84a compared to the other genotypes (ANOVA with post-hoc t-tests; p< 0.0001).
(C) Representative traces of extracellular recordings of neuronal responses to the indicated dilution of phenylacetaldehyde in control ac3 sensilla (UAS-IR84a/+) (left), in ac3 sensilla in animals in which IR84a is mis-expressed in OR35a neurons (UAS-IR84a/+;OR35a-GAL4/+) (middle) and in ac4 sensilla from UAS-IR84a/+;OR35a-GAL4/+ animals (right). ac3 sensilla were unambiguously identified by their responses to propionic acid and hexanol [see (A-B)]. Bars above the traces mark stimulus time (1 s).
(D) Quantification of mean responses to the phenylacetaldehyde stimuli indicated for the three genotypes shown in (C) (± s.e.m; n=10-16, male flies). At 0.1% phenylacetaldehyde, the ac3 + IR84a and ac4 responses are both significantly higher than the control ac3 sensilla (ANOVA with post-hoc t-tests; p< 0.0008); at 1% and 10%, the ac3+ IR84a sensilla responses are significantly higher than ac4 (ANOVA with post-hoc t-tests; p< 0.0001).
(E) Plot of dose-responses curves of data shown in (D), in which the ac4 sensilla phenylacetaldehyde responses have been corrected for the paraffin oil response, and the phenylacetaldehyde responses of ac3 + IR84a sensilla have been corrected for both paraffin oil responses and endogenous weak ac3 phenylacetaldehyde responses [grey values in (D)]. The curves are not significantly different at any stimulus concentration (ANOVA; p=0.6629).