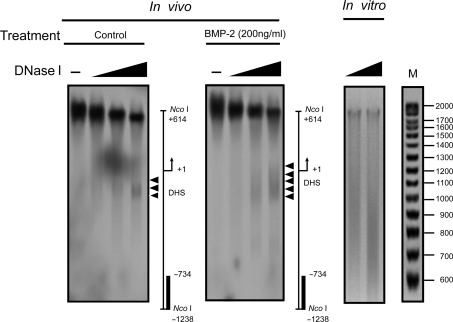
Figure 4.
Mapping of the BMP-2-induced DNase I hypersensitivity within the proximal FGFR3 promoter. C3H10T1/2 cells were treated with or without 200 ng/ml BMP-2 with 5% FBS for 1 day. Nuclei were then purified and digested with increasing concentrations of DNase I (0, 1, 3, 5 U/ml) and DNA was purified and cleaved with Nco I. After Southern blotting, the filter was hybridized with the 32P-labeled probe used in the MNase digestion assay. The DNase I-hypersensitive sites are indicated by arrowheads. As a control, purified genomic DNA from C3H10T1/2 cells was digested in vitro with increasing concentrations of DNase I. Size markers were generated as described in ‘Material and Methods’ section. The diagrams at the right of each panel indicate the positions of the transcription start site and the probes used for hybridization (solid bars). The large signal near +1 in the figure on the left is an autoradiograph artifact.

