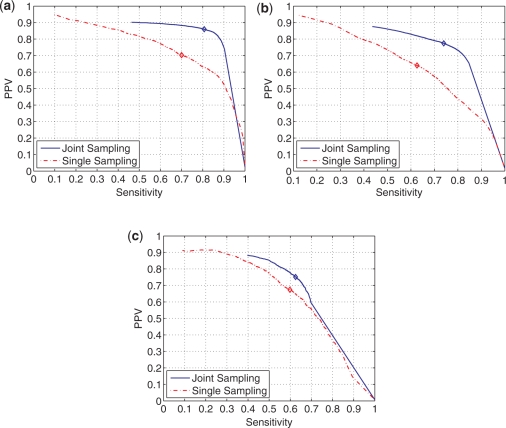
Figure 5.
Plot of sensitivity versus PPV of paired bases with estimated pairing probability (by joint and single sequence sampling methods) greater than a probability threshold while threshold probability ranges from 0.0 to 1.0. The diamonds on each curve denote the sensitivity and PPV values when the threshold probability is 0.50. (a) tRNA. (b) 5S rRNA. (c) RNase P.

