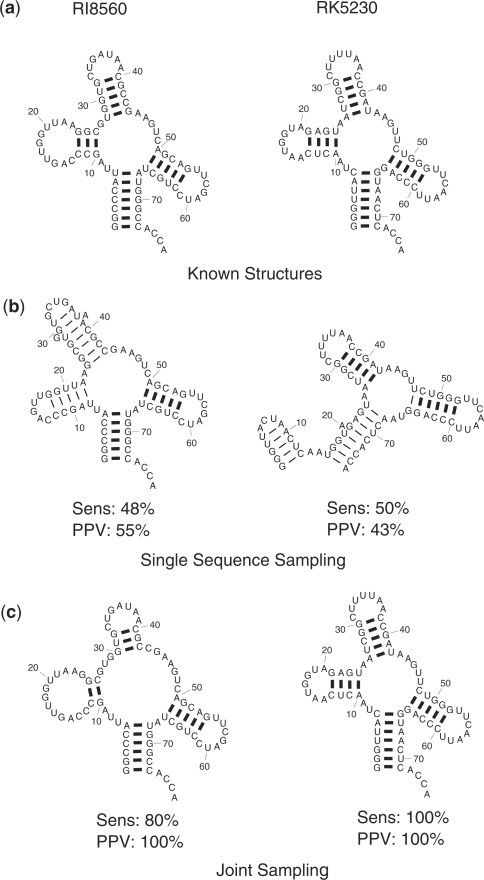
Figure 7.
The biggest cluster centroid structures of tRNA sequences RI8560 and RK5230 computed from sample of 1000 structures generated by single sequence sampling and joint sampling. (a) Known structures of each sequence. (b) Centroid of the most populated cluster for single sequence sampling. (c) Centroids of the most populated cluster for joint sampling of the sequences. The sensitivity and PPV of each centroid is shown by “Sens” and “PPV” respectively below the structure.

