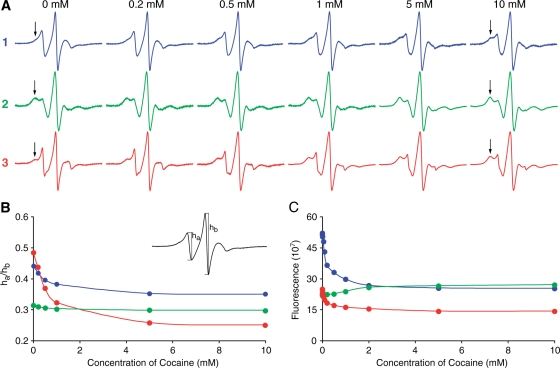
Figure 3.
(A) EPR spectra of the spin-labeled aptamers 1 (blue), 2 (green) and 3 (red) at various concentrations of cocaine in an aqueous solution at 20°C. The slow-motion component of the EPR spectra is indicated by an arrow. (B) A plot of the ha/hb ratio of the aptamer EPR spectra (see insert) vs. concentration of cocaine. ha is the height of the low-field peak and hb is the height of the centre peak of the EPR spectrum. (C) Relative fluorescence of reduced aptamers 1–3, plotted as a function of cocaine concentration in an aqueous solution at 20°C.

