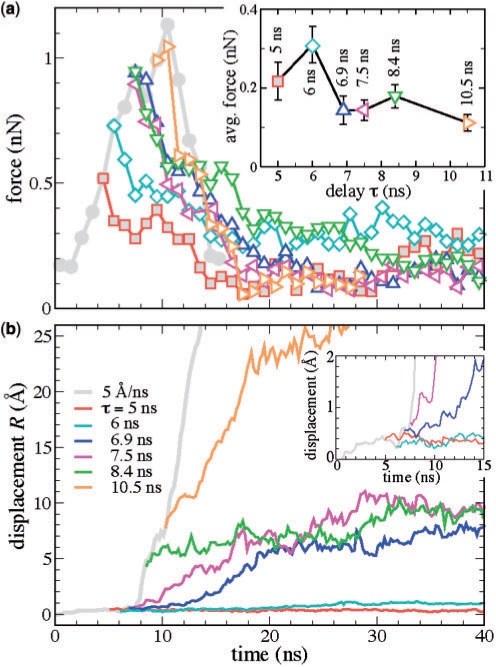
Figure 5.
Forces and deformations in the EcoRI–DNA complex during stopped (vsmd = 0) SMD simulations. (a) The SMD force during the reference and stopped SMD simulation. The reference (vsmd = 0.5 nm/ns) SMD simulation is indicated by filled gray circles. Each stopped SMD simulation has a fragment of the reference SMD simulation of duration τ, after which the SMD velocity was set to zero. The insert shows the dependence of the SMD force averaged over the last 10 ns of each simulation on τ. (b) The displacement parameter R for the reference and stopped SMD simulations. The insert shows a close-up of R(t) for the first 15 ns of the simulations.

