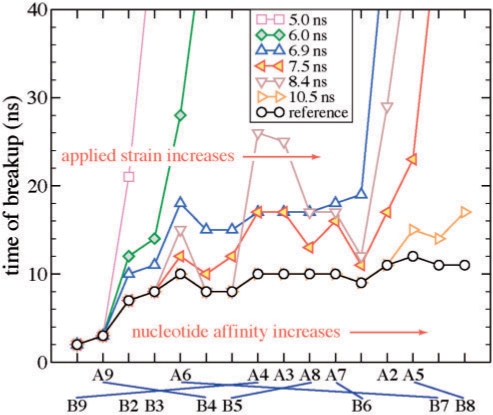
Figure 6.
Timeline of rupture of individual nucleotides from EcoRI. The nucleotides are listed along the horizontal axis, left to right, in the sequence they break away from their docked positions. Bonds between nucleotides of DNA chains A and B forming base pairs are shown schematically. Each data line corresponds to a particular SMD simulation. Time to rupture of each nucleotide in a particular simulation is shown along the vertical axis. The absence of a data point for a particular nucleotide on a given line means that the rupture of this nucleotide was not observed within the length of the respective simulation. All simulations, except for the reference and τ = 10.5 ns simulations, lasted ∼40 ns.

