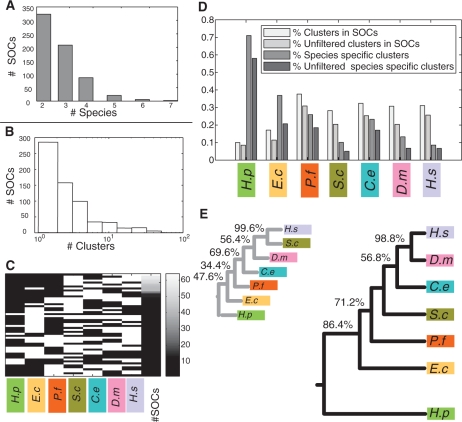
Figure 2.
Statistics on SOCs. (A) Number of species in the obtained SOCs. (B) Distribution of SOC sizes (number of clusters in SOC). (C) Phyletic patterns of SOCs. Each row represents an observed phyletic pattern, where white indicates presence and black indicates absence. The first seven columns to the left correspond to the different species. The eighth column depicts the frequency of the corresponding pattern, coded according to the color-bar on the right-most column. (D) Fractions of clusters participating in SOCs. Four bars are shown for each species (from left to right): fraction of clusters which are members of a SOC; fraction of clusters which are members of a SOC and pass the false negative filtering criterion (Supplementary Data); fraction of species-specific clusters; and fraction of species-specific clusters after filtering. (E) Phylogenetic trees relating the participating species. The larger tree (on the right) was reconstructed based on co-membership in SOCs. The tree on the left is based on conservation of single interactions. Percentages indicate the reproducibility of each branch in a bootstrap analysis (if different from 100%). Species names are abbreviated as follows: H. sapiens (H.s), D. melanogaster (D.m), C. elegans (C.e), S. cerevisiae (S.c), P. falciparum (P.f), E. coli (E.c) and H. pylori (H.p).

