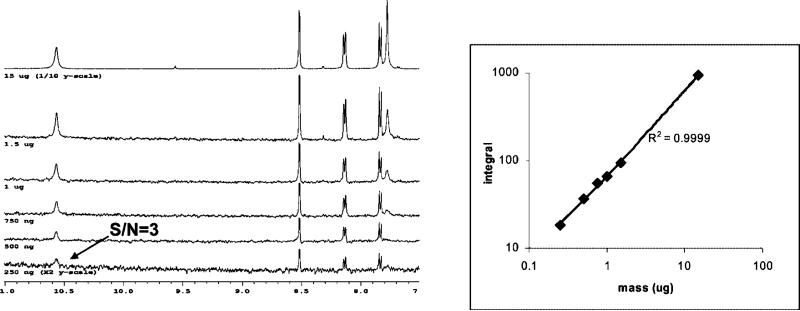
Figure 4.
LOD following the linearity of 8.5 ppm indapamide peak over six concentrations and resulting concentration curve. (Left) Regions of the NMR spectra of indapamide indicating the smallest peak, used to determine LOD. (Right) The plot of NMR integrals of indapamide (as in Figure 3) versus amount loaded onto the LC column, showing linear dynamic range over the six concentrations analyzed.

