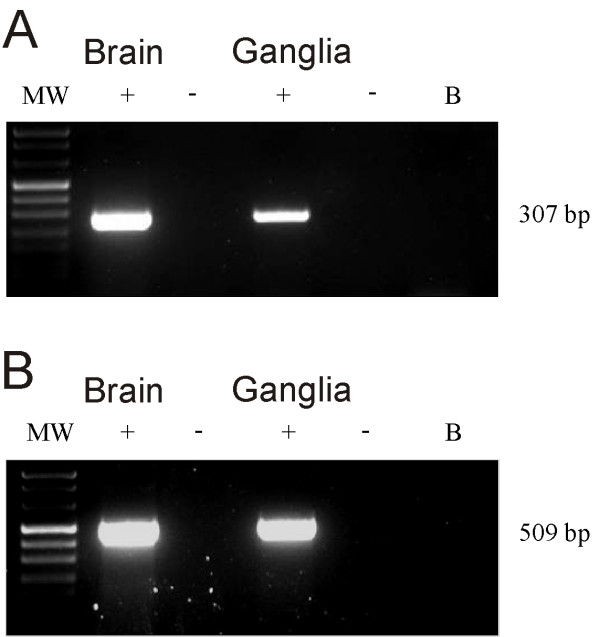
Figure 1.
Reverse transcriptase-PCR analysis in the mouse vestibular ganglia. A: mRNA RT-PCR for H3 receptor expression in mouse brain and Scarpa's ganglia. B: mRNA RT-PCR for β-actin expression in mouse brain and Scarpa's ganglia. The 307 and 509 bp bands correspond to the H3 and β-actin specific PCR products, respectively. β-actin mRNA was used as the internal control.

