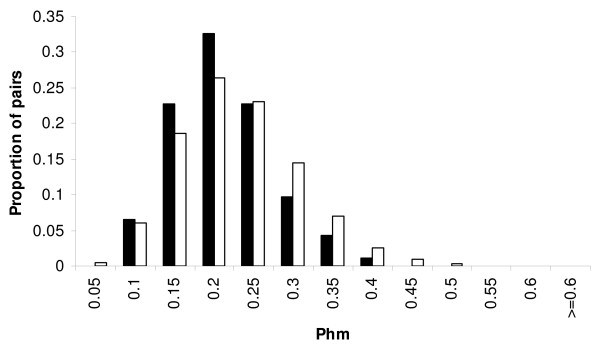
Figure 1.
Distribution of genetic similarity (calculated with the Phm index) in pairs observed in 2003 and/or 2004. Black bars represent the percentage of observed pairs (n = 92) and white bars represent a random distribution of the Phm of pairs obtained by simulating 10,000 pairings. Phm was calculated with all ten loci. Kittiwake pairs were less genetically similar than expected by chance (p = 0.016).

