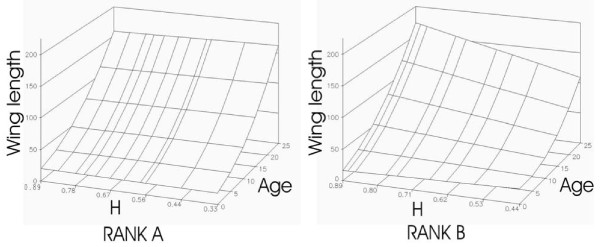
Figure 4.
Relationship between chick heterozygosity, age and growth rate in 2005. We plotted the predicted value of chick growth in wing length (in mm) according to the model A+H+R+AH+AR+HR+ARH+A2 where A is the age of the chick (measured in days), R its hatching rank (binary factor equaling A for first hatched, or B for second hatched chicks) and H its heterozygosity (according to the H index). For clarity, the random parameter (chick's identity) was removed from the model. Significance of the statistical tests is given in Table 2.

