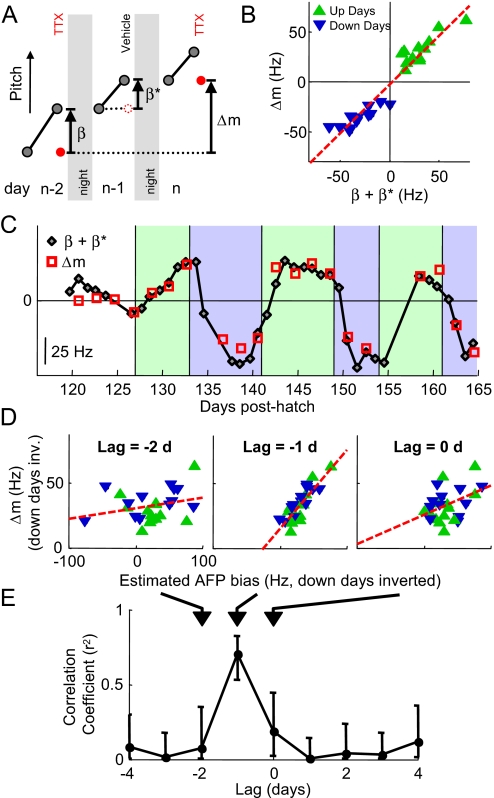
Fig. 5.
AFP bias is predictive of subsequent plasticity in the motor pathway. (A) Motor plasticity was assessed as the difference (Δm) in LMAN(−) pitch between successive inactivations (red dots), carried out every other day. Gray dots represent morning and preinactivation syllable pitch. We examined the relation between motor plasticity and the estimated total AFP bias over a corresponding 2-day interval. The total was computed as the sum (β+β*) of the AFP bias on TTX days (β) plus the AFP bias on vehicle days (β*)—the latter estimated as the amount of learning that occurred during the day (see Fig. 4). (B) Scatter plot of motor plasticity (Δm) and estimated 2-day sum of AFP bias (β+β*; linear regression, red dashed line; slope = 0.99 ± 0.06, r2 = 0.93). (C) Time series of Δm (red squares) and a 2-day running sum of estimated AFP bias 1 day earlier (black diamonds), as shown in A. (D) Scatter plots showing the correlation between Δm versus the estimated 2-day sum of AFP bias at lags of −2, −1, and 0 days (linear regression, red dashed line; slopes = 0.08 ± 0.06, 0.61 ± 0.08, 0.23 ± 0.10 respectively; up and down days combined by inverting down days; see Fig. S7). A–C correspond to a lag of −1 day. (E) Correlation coefficients as a function of time lag (days). Errors bars are 95% confidence intervals.

