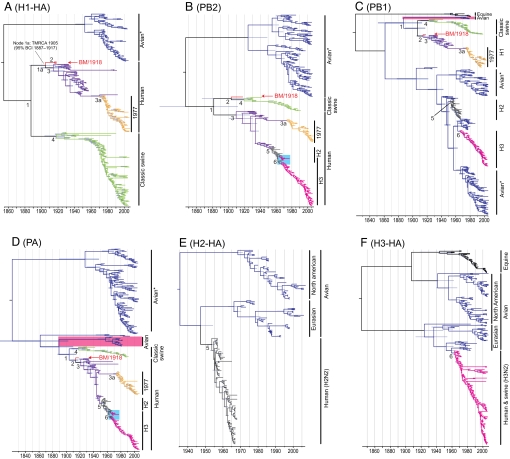
Fig. 1.
Dated phylogenies of influenza A virus genes. (A) H1-HA, (B) PB2, (C) PB1, (D) PA, (E) H2-HA, and (F) H3-HA gene trees scaled to time (Horizontal Axis) generated using the SRD06 codon model and uncorrelated relaxed clock model. Nodes correspond to mean TMRCAs, and blue horizontal bars at nodes represent the 95% BCIs of TMRCAs. Colored branches represent major influenza A virus lineages. The blue boxes in B and D indicate a period of co-circulation of H2 and H3 viruses. Identical phylogenetic trees with virus names are available online in the supporting information. TMRCAs and BCIs for each of the major influenza A virus lineages are given in Table 1.

