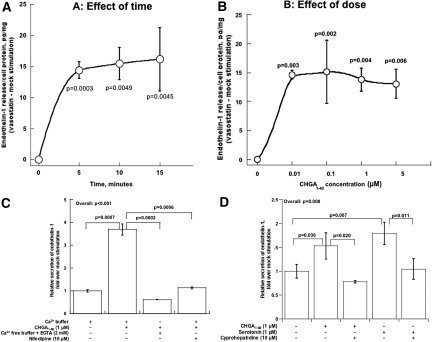
Figure 2.
CHGA1–40-induced secretion of EDN1 from human endothelial cells. (A) Effect of time. Results are presented as mean ± SEM over three measurements. Data are shown as net EDN1 release (CHGA1–40 minus mock stimulation). HUVECs were incubated with 1 μM CHGA1–40 for the indicated times. (B) Effect of dose. Results are presented as mean ± SEM over three measurements. Data are shown as net EDN1 release (CHGA1–40 minus mock stimulation). HUVECs were incubated with the indicated concentrations of CHGA1–40 for 15 min. (C) Dependence on extracellular calcium. HUVECs were incubated for 15 min with the indicated concentrations of CHGA1–40, with or without calcium in the medium. Release of EDN1 from unstimulated controls was set as 100%. Data are shown as fold release over control. Results are presented as mean ± SEM over three measurements. (D) Probing a serotonin pathway. HUVECs were incubated for 15 min with the indicated concentrations of agonists (CHGA1–40 or serotonin), with or without serotonin antagonist (cyproheptadine). Release of EDN1 from unstimulated controls was set as 100%. Data are shown as fold release over control. Results are presented as mean ± SEM over three measurements.

