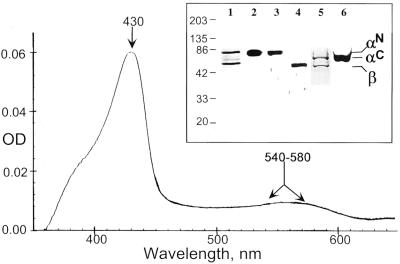
Figure 2.
Analysis of purified sGC protein. Spectral analysis of the purified human sGC enzyme displayed a typical Soret band (430 nm) and the broad α/β band (540–580 nm) indicated by arrows. (Inset) A total of 250 ng of purified recombinant αNβ (lanes 1–3) and αCβ (lanes 4–6) sGC was separated by 7.5% SDS/PAGE and analyzed by silver staining (lanes 1 and 5) or by Western blotting. The identity of the upper bands as α-subunit was confirmed by anti-hexahistidine antibody (lanes 2 and 6) and validated by antibodies to α-sGC subunit (lane 3). The identity of the lower band as β-subunit was confirmed by antibodies raised against human β-sGC subunit (lane 4). The different mobility of αN and αC subunits reflects the difference in the size of the tag. The sizes of the molecular mass markers are indicated in kDa.

