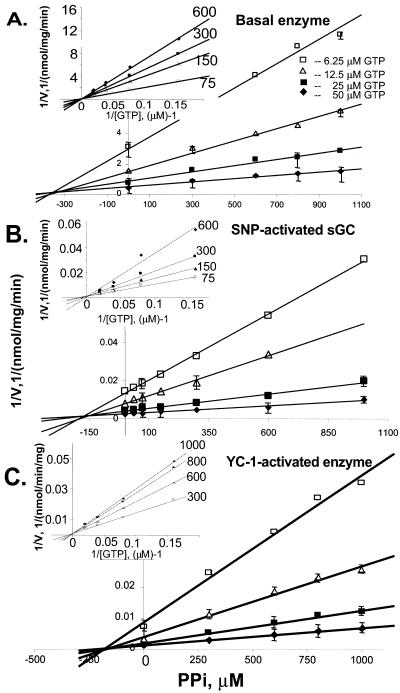
Figure 4.
Inhibition of sGC activity by PPi. The PPi inhibition was measured for the basal (A), SNP-stimulated (B), and YC-1-activated (C) human sGC. The activity was measured at various concentrations of PPi and GTP. The data are represented as Dixon plot (1/velocity vs. concentration of the inhibitor). The Ki for PPi was determined as the projection to the abscissa at the intersection point of the plots. The replotting of the data as 1/velocity vs. 1/[GTP]. (Insets) Indicated competitive type of inhibition by PPi. The concentrations of PPi are indicated for each plot (μM). The plots are representative of three independent measurements for both αNβ and αCβ enzymes with similar results. The plotted data are means of triplicate value ± SD. Some error bars fall within the symbols.

