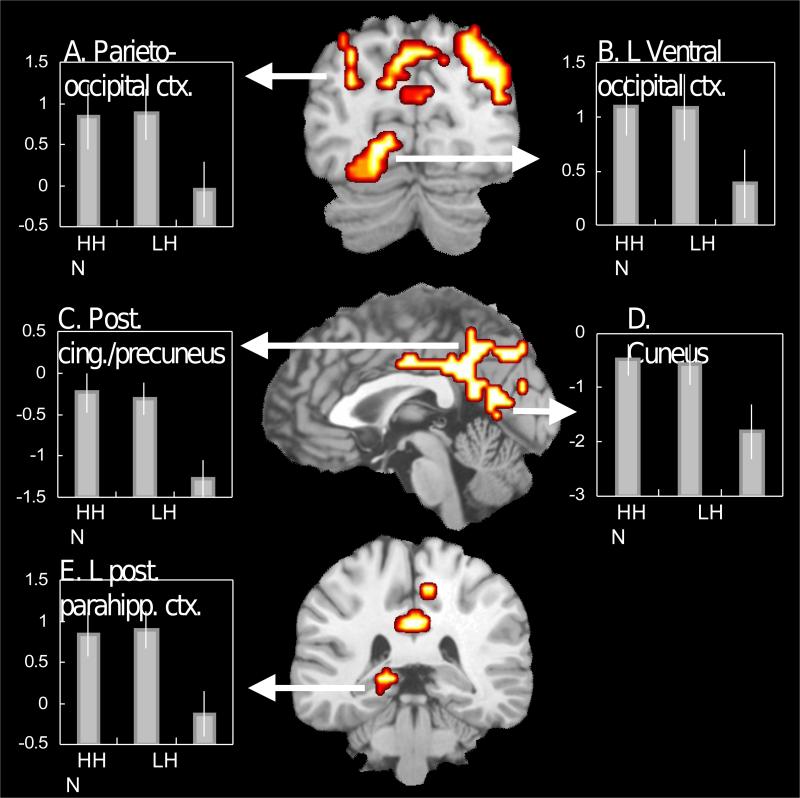
Figure 2.
Brain regions associated with both high-confidence and low-confidence recognition activity. The bar graphs display mean parameter estimates across all significant voxels. The error bars indicate ±1 SE. HH = high-confidence hit; LH = low-confidence hit; N = high-confidence correct rejection responses.

