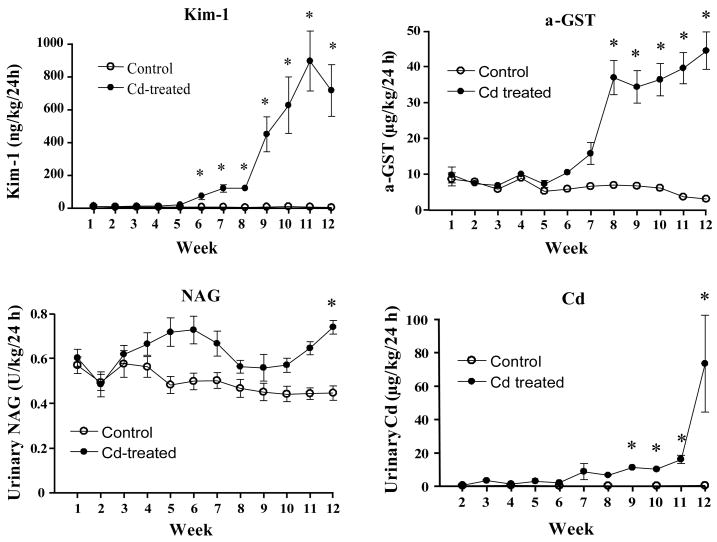
Figure 2. Effects of Cd treatment on the urinary excretion of Kim-1, α-GST, NAG and Cd.
Animals were treated with Cd (0.6 mg/kg, 5 days per week) for up to 12 weeks and weekly urine samples were analyzed for levels of Kim-1, α-GST, NAG and Cd as described in the Methods section. Values represent the mean ± SE. An * denotes significant differences from week matched control values (p < 0.05) as determined by the non-parametric Kruskal-Wallis test and Dunn’s posthoc test for multiple comparisons For the Kim-1 data, n = 22 for weeks 1–6 and 16 for weeks 7–12; for α-GST, n=9–12; for NAG, n=11–12 and for Cd n=5–6 for each data point.

