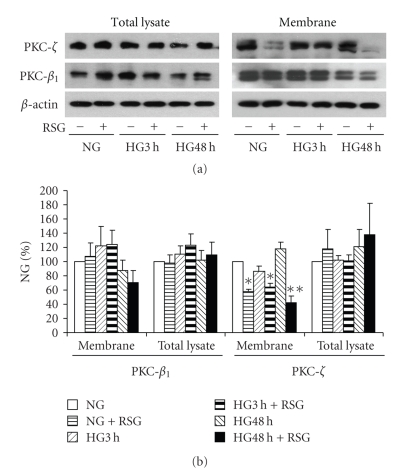
Figure 6.
PKC-β1 and PKC-ζ response to high glucose and rosiglitazone. Mesangial cells were exposed to 5.6 mM (NG) or 25 mM (HG) for 3 hours or 48 hours pretreated with 10 μM rosiglitazone (RSG) for 1 hour. PKC-β 1 and PKC-ζ were detected in total cell lysates or membrane fractions with immunoblotting. (a) Representative immunoblots of PKC-β 1 and PKC-ζ. (b) Quantitative analysis of the immunoblots (n = 5, *P < .05 versus NG without RSG, **P < .01 versus HG without RSG).

