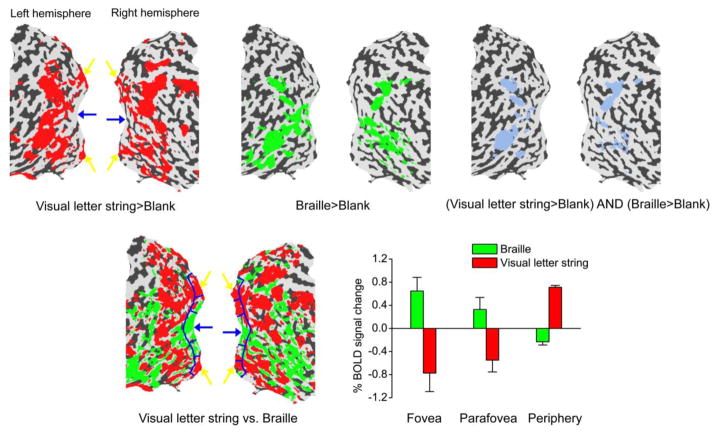
Figure 2.
fMRI activation maps by visual letter string and Braille in S. Statistical significance maps (thresholded at corrected p < 0.01) are shown on the flattened surface reconstruction of the posterior part of S’s brain. Upper left: Red regions were activated by visual letter strings contrasting with blank intervals. Upper middle: Green regions were activated by Braille contrasting with blank intervals. Upper right: Blue regions were activated by both visual letter strings and Braille contrasting with blank intervals. Lower left: Visual letter string and Braille conditions were contrasted with each other. Red regions showed higher response to visual letter strings than to Braille, and green regions showed the opposite. S’s foveal and peripheral representations in V1 are indicated by blue and yellow arrows respectively. Lower right: BOLD signals evoked by Braille and visual letter strings relative to blank intervals in three V1 subregions (Talairach coordinates shown in parentheses) – fovea (left: −21, −95,−4; right: 17, −95, −8), parafovea (left: −6, −94, −9; right: 4, −92, −7) and periphery (left: −5, −75, −6; right: 3, −75, −1). The three subregions are delineated by blue curves in the lower left panel. Error bars denote 1 standard error of mean across scans.

