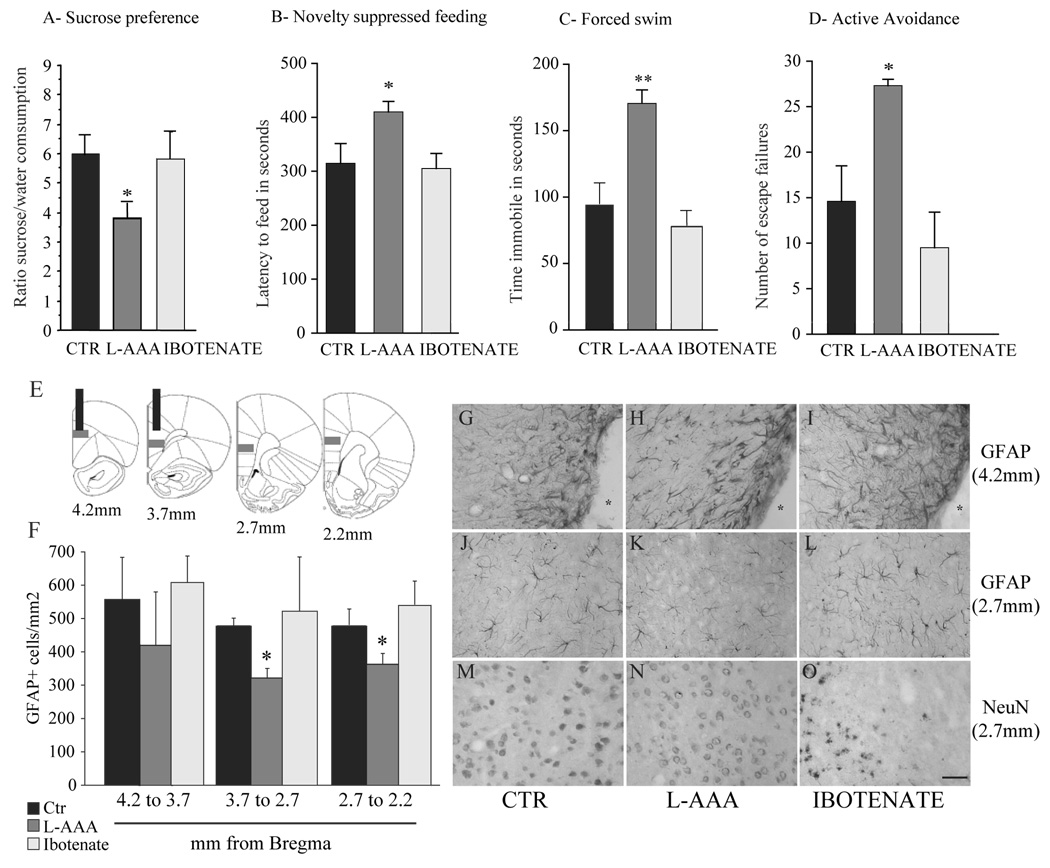
Figure 5.
Influence of L-AAA or ibotenate infusions in the PFC on behavior, astroglia and neurons. Animals received infusions of saline (CTR), L-AAA or ibotenate as indicated and were consecutively tested in sucrose preference (A, day 3), novelty suppressed feeding (B, day 4), forced swim (C, day 5) and active avoidance (D, day 6) tests. Results are expressed as mean ± s.e.m. ratio sucrose vs. water consumed (A), latency to feed in seconds (B), time spent immobile in seconds (C) and number of escape failures (D). * P<0.05, ** P<0.01, compared to CTR. Density of GFAP-positive cells was quantified in the PLC of animals subjected to L-AAA and ibotenate animals and compared to CTR. Number of GFAP-positive cells was quantified throughout the PLC as described in E (gray squares), and results are expressed as mean ± s.e.m. number of GFAP-positive cells/mm2 (F) * P<0.05, compared to CTR. Representative micrographs of GFAP (G–K) or NeuN immunostained sections (MO) showing the effects of L-AAA (H, K, N)) or ibotenate (I, L, O) are shown. The cannula site (4.2 mm from bregma) is marked by a star (*, G-I). Consequences of L-AAA or ibotenate on GFAP or NeuN immunostaining in fields away from the cannula site (level 2.7 mm from bregma) compared to saline infusions are shown (J–O). Scale bar = 100 μm.

