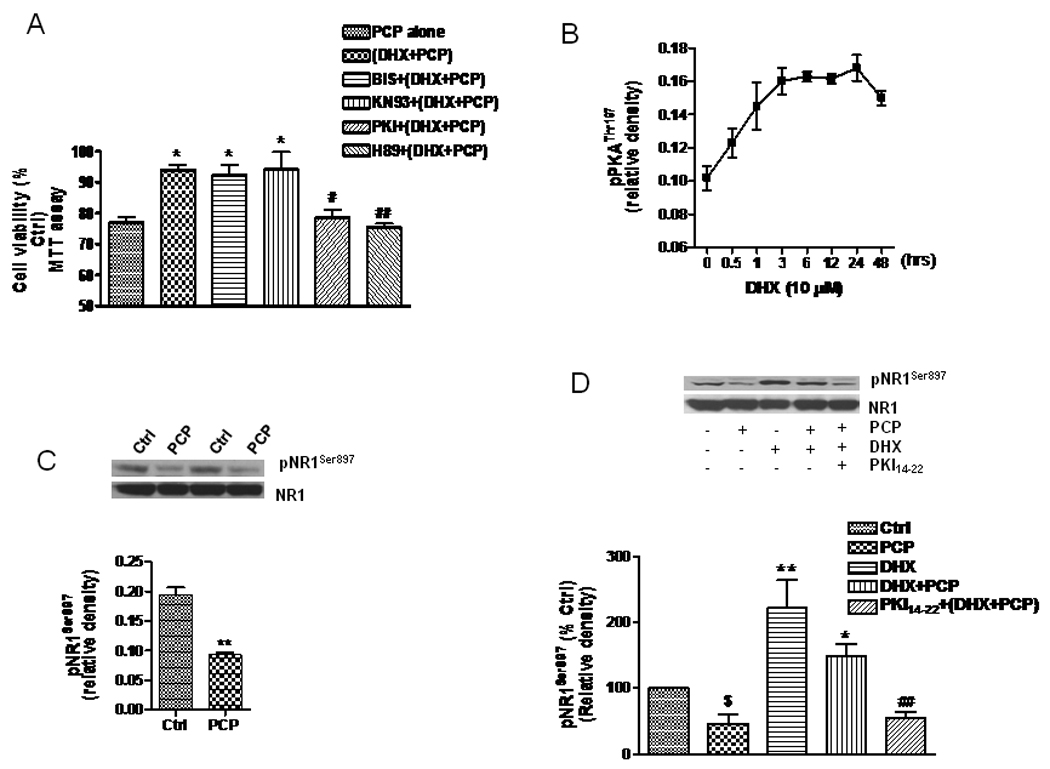
Figure 2. The role of PKA on D1R-mediated protection and attenuation of PCP-induced reduction of NR1 phosphorylation.

A. PCP-treated neuronal cells (DIV14) were treated for three hrs with either DHX (10 µM) alone or 2.5 µM with Bic, or they were pretreated with BIS (1 µM), KN93 (2 µM), H89 (10 µM) or PKI14–22 (0.5 µM) for 1h, followed by DHX (10 µM) plus Bic (2.5 µM) for another 3h. The treated cells were then exposed to PCP (1 µM) for 48h. Cell viability was determined by assessing MTT metabolism. B. Cultured neurons were treated with DHX (10 µM) for different times and lysed in ice-cold RIPA buffer containing inhibitors of proteinases, kinases and phosphatases. The cell lysate (15 µg) was used for WB to determine pPKAThr197. The time course data, normalized to β-actin, were quantified from three independent WB experiments. C. Cultured neurons were treated on DIV 14 with 1 µM PCP for 24h, then lysed for WB. The upper panel shows 2 examples of reduction of pNR1Ser897 after PCP treatment, while the lower panel is the quantification of 3 different WB. D. The cells were treated with PCP (1 µM), DHX (10 µM), or combination of PCP and DHX in the presence or absence of the PKA inhibitor, PKI14–42 (1 µM). Phosphorylation of NR1 (pNR1S897) was determined by WB (upper panel). Data are summarized from 3 independent experiments (lower panel). The values shown are mean ± SEM (*, # and $ P<0.05, ** and ## P< 0.01, * and ** compared with PCP group; # and ##, compared with DHX+PCP group; $ vs control group, one way ANOVA with Newman-Keuls posthoc analysis, N= 3–4/group).
