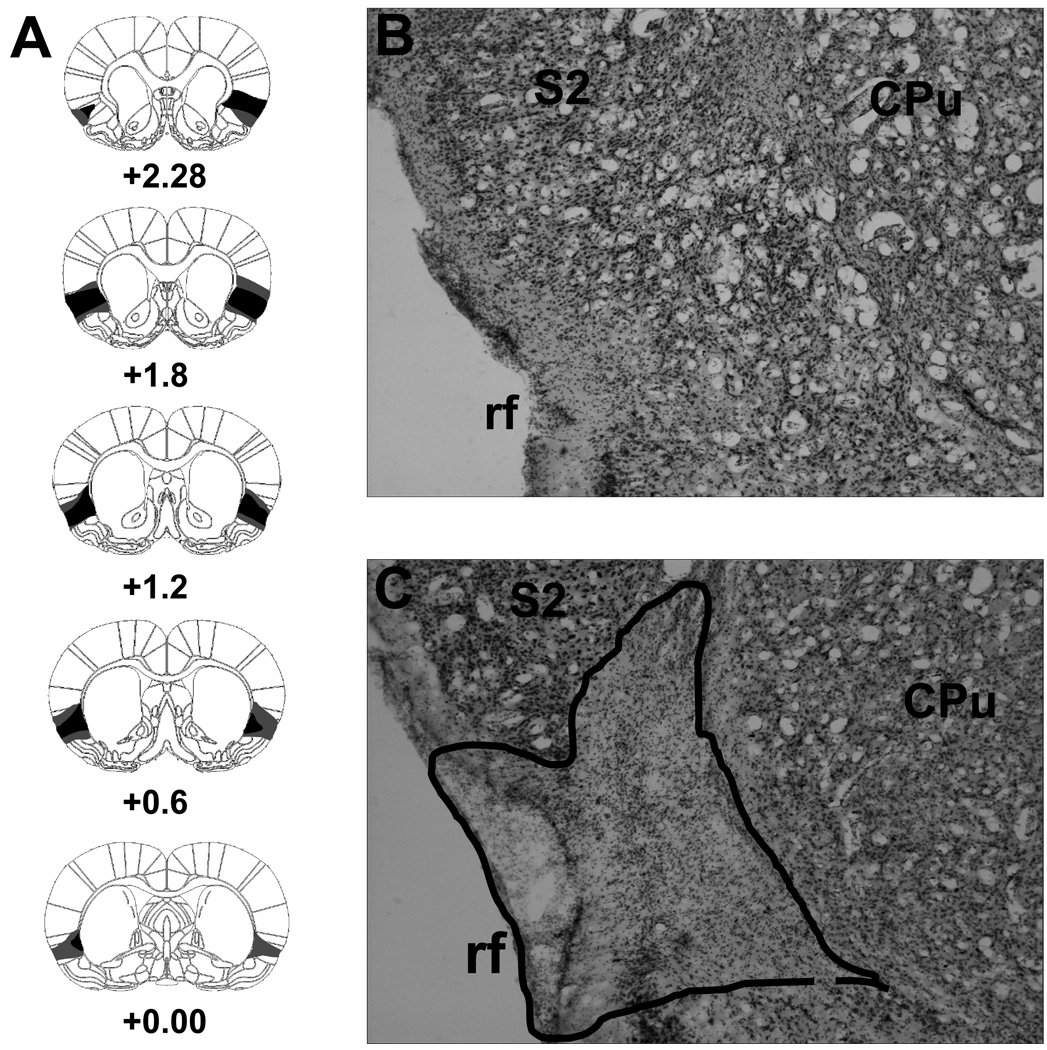
Figure 1.
Serial reconstructions (Panel A) of the smallest (black) and largest (gray) lesions of the insular cortex at five coronal levels (+2.28, +1.80, +1.20, +0.60, 0.00 relative to bregma). Representative digital photomicrographs of a cresyl violet-stained coronal section (approximately +1.0 mm relative to bregma) through the insular cortex of a neurologically intact subject (Panel B) and a rat with a neurotoxic lesion (Panel C). The extent of cell loss is outlined with a dashed line. CPu = caudate putamen; rf = rhinal fissure; S2 = secondary somatosensory cortex. The diagrams in Panel A are adapted with permission from (Paxinos and Watson 2005).

