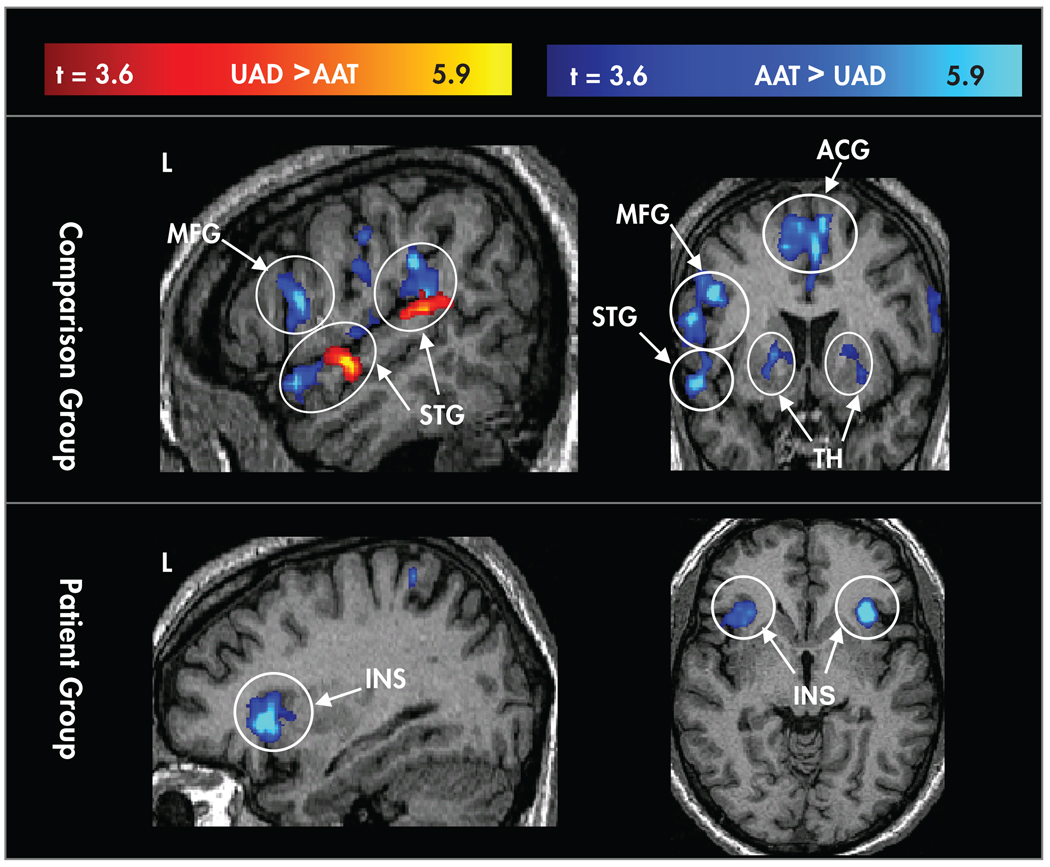
FIGURE 2. Random-Effects Maps for Contrasts (t>3.6) Between Conditions in the Comparison Group (Upper Panel) and the Schizophrenia Patient Group (Lower Panel).
Areas where the contrast for attended auditory target (AAT) > unattended auditory deviant (UAD) are coded in blue, and areas where UAD>AAT are coded in red. Controlled processing showed greater activation in both groups in the bilateral insula (INS). The comparison group showed additional areas with greater activation for controlled processing including the left middle frontal gyrus (MFG), thalamus (TH), dorsal anterior cingulate gyrus (ACG), and anterior and posterior aspects of the left superior temporal gyrus (STG).

