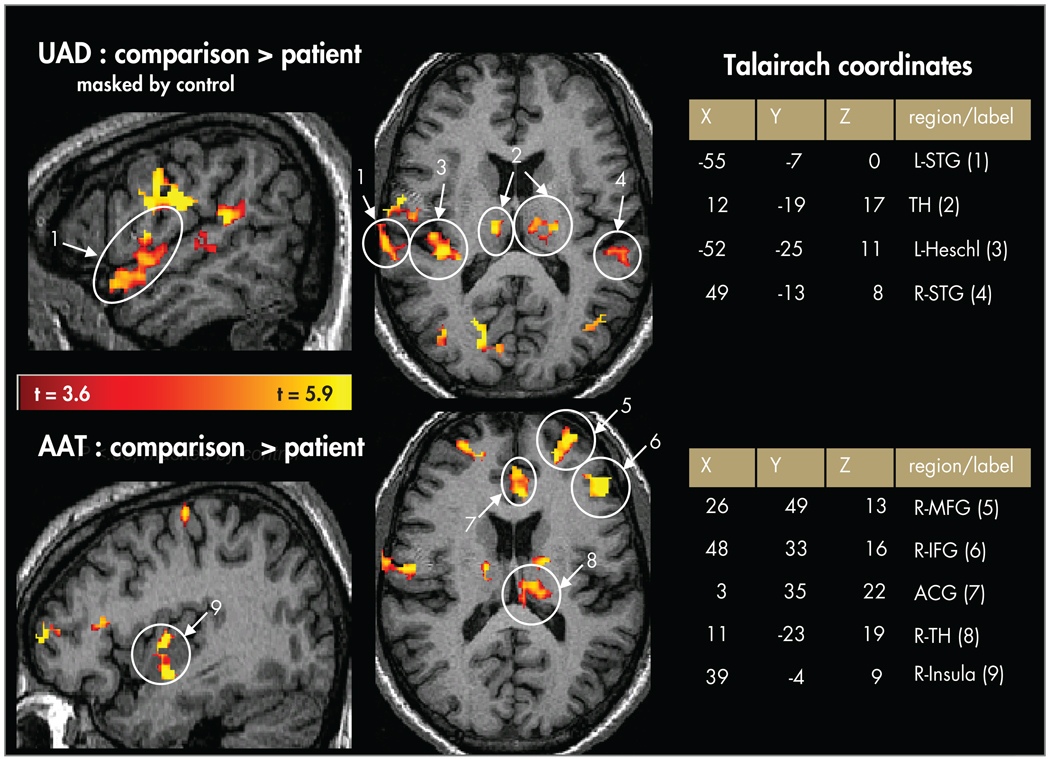
FIGURE 3. Random-Effects Contrast Maps (t>3.6; Masked by Active Voxels in the Comparison Group) Showing Comparison > Patient Activation.
Upper panels=unattended auditory deviant (UAD) condition in superior temporal gyrus (STG), Heschl’s gyrus (primary auditory cortex), and thalamus. Lower panels=random-effects contrast maps showing comparison > patient activation for the attended auditory target (AAT) condition in middle frontal gyrus (MFG), inferior frontal gyrus (IFG), anterior cingulate gyrus (ACG), thalamus (TH), and insula.

