
Figure 1.
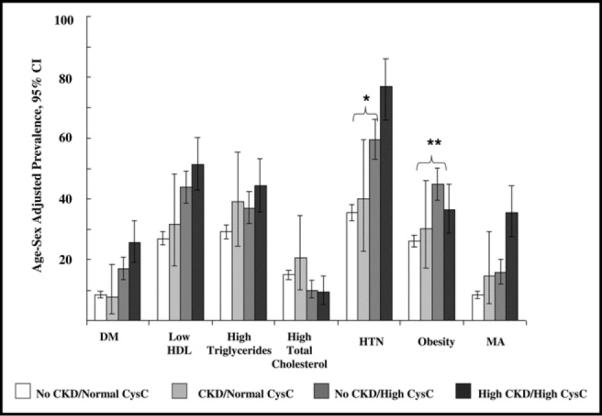
Age and sex-adjusted prevalence of CVD risk factors with cross classification of CKD and CysC (where CKD defined as GFR <60 mL/min per 1.73 m2 and CysC as <1.07 mg/L). Comparison of age- and sex-adjusted risk factor prevalence between participants with CKD/normal CysC (n = 59) and participants with no CKD/High CysC (n = 519): hypertension; *p = 0.02; for obesity **p = 0.01; all other values of p nonsignificant. DM = diabetes mellitus, HTN = hypertension.