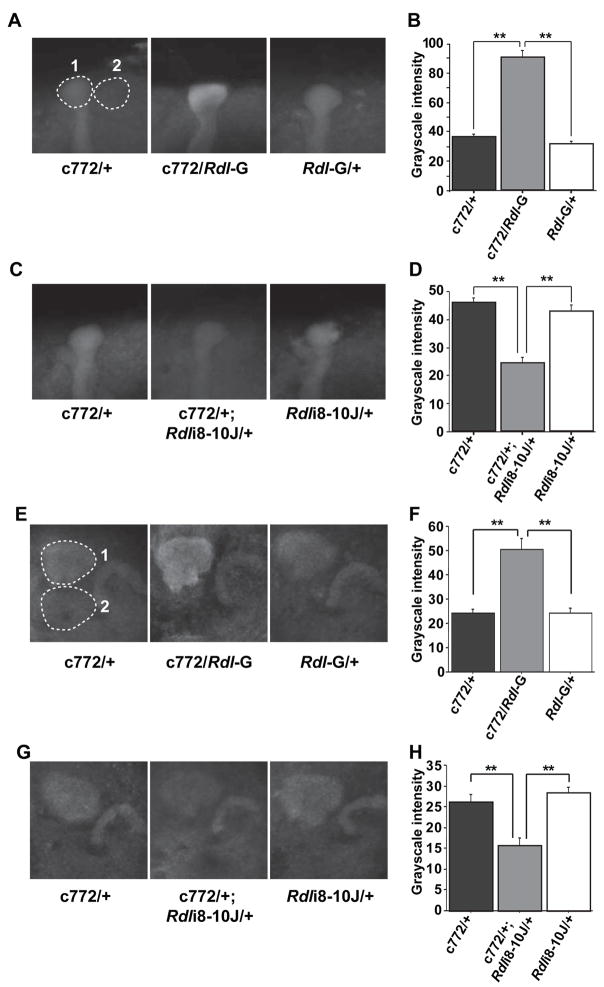
Figure 3. Quantification of Rdl over-expression and knock-down in the MBs using the c772-Gal4 driver.
(A) Representative grayscale images of anti-RDL immunofluorescence in Rdl over-expressing flies (c772/Rdl-G) and in control flies carrying only the c772-Gal4 driver (c772/+) or the UAS-Rdl transgene (Rdl-G/+). Each image is an average projection image through the tip of the α lobes, such that the signal intensity represents the 3-dimensional volume of the region. The Rdl expression level was calculated as the signal intensity of the α lobe tip (dashed circle #1) after subtracting the signal intensity of a nearby background region (dashed circle #2) of the same size and shape.
(B) Quantification of Rdl over-expression in the α lobe tips. Twenty-four samples of each genotype (n=24) were quantified as described in (A) using the same confocal settings. The average grayscale intensity for all three groups is plotted in (B). Means ± SEM are shown.
(C) Representative images of anti-RDL immunofluorescence in the Rdl knock-down flies (c772/+; Rdli8-10J/+) and in control flies carrying only the c772-Gal4 driver (c772/+) or the UAS-RdlRNAi transgene (Rdli8-10J/+).
(D) Quantification of Rdl knock-down in the α lobe tips using twenty-four samples of each genotype (n=24).
(E) Representative grayscale images of anti-RDL immunofluorescence in Rdl over-expressing flies (c772/Rdl-G) and in control flies carrying only the c772-Gal4 driver (c772/+) or the UAS-Rdl transgene (Rdl-G/+). Each image is an average projection image through the calyces. The Rdl expression level was calculated as the signal intensity of the calyx (dashed circle #1) after subtracting the signal intensity of a nearby background region (dashed circle #2) of the same size and shape. Note that in the two control flies, there was comparable signal intensity in the calyx and the protocerebral bridge but in the over-expression group, there was an elevated signal for RDL in the calyx compared to the protocerebral bridge. This served as an internal control for MB specific over-expression of Rdl. The converse was true for the knock-down flies, where there was a reduced signal in the calyx compared to the protocerebral bridge (G).
(F) Quantification of Rdl over-expression in the calyces using twenty-four samples of each genotype (n=24).
(G) Representative images of anti-RDL immunofluorescence in the Rdl knock-down flies (c772/+; Rdli8-10J/+) and in control flies carrying only the c772-Gal4 driver (c772/+) or the UAS-RdlRNAi transgene (Rdli8-10J/+).
(H) Quantification of Rdl knock-down in the calyces using twenty-four samples of each genotype (n=24). **: P<0.01. Data for panels (B) and (D), (F) and (G) were obtained from two separate experiments.

