
Figure 1. Design of working memory experiment and resulting time course of fMRI activity.
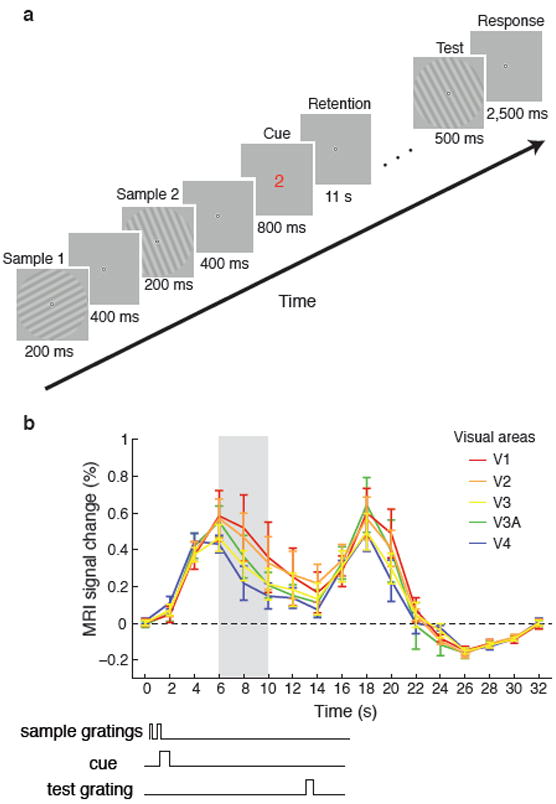
a, Timing of events for an example working memory trial. Two near-orthogonal gratings (25°±3°, 115±3°) were briefly presented in randomized order, followed by a numerical cue (red “1” or green “2”) indicating which grating to remember. After an 11s retention period, a test grating was presented, and subjects reported whether it was rotated clockwise or counterclockwise relative to the cued grating. b, Time course of mean BOLD activity (N=6) in corresponding regions of areas V1–V4 during the working memory task (0–16s) and subsequent fixation period (16–32s). Error bars indicate ±1 S.E.M. Time points 6–10s (shaded grey area) were averaged for subsequent decoding analysis of delay-period activity. The start of this time window was chosen to allow for peak BOLD activity to fully emerge; we selected a conservative end point of 10s to exclude any potential activity elicited by the test grating.