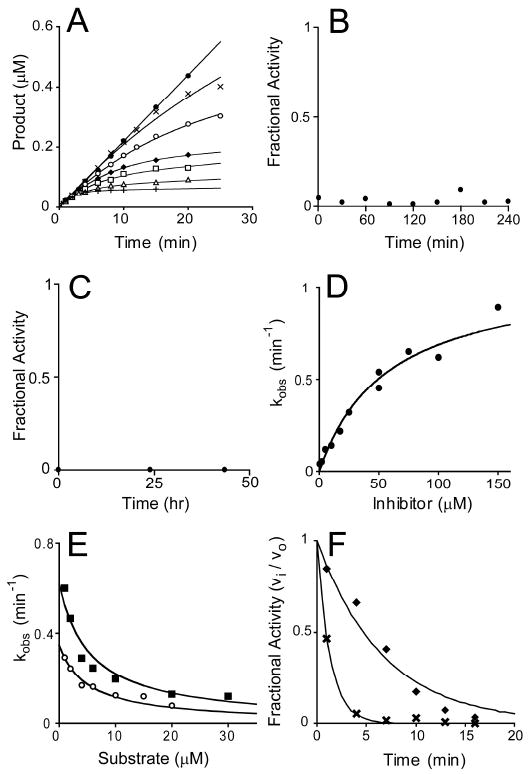
Figure 3.

Slow, kinetically irreversible and competitive inhibition of E. coli LpxC by 1-68A. (Panel A) Progress curves for product formation when reactions are initiated by the addition of enzyme in the presence 0 μM (black circles), 0.5 μM (black Xs), 2 μM (open circles), 5 μM (black diamonds), 10 μM (open squares), 17.5 μM (open triangles), or 50 μM (black pluses) 1-68A as fitted with Eq. 2. Data is representative of two separate experiments. (Panel B) Rapid dilution of the E. coli LpxC – 1-68A complex. (Panel C) E. coli LpxC activity following dialysis of the LpxC – 1-68A complex. (Panel D) A plot of the observed pseudo first-order rate constant for the formation of the E-I complex (kobs) as fitted with Eq. 3. Repeat experiments (not shown) gave identical results (within 10 %). (Panel E) A plot showing the effect of increasing substrate concentrations on the observed first order rate constant (kobs) in the presence of 10 μM (open circles) or 25 μM (black squares) 1-68A. Eq. 4 was fitted to these data. These plots include data from three independent experiments. (Panel F) The fractional activity of LpxC after a preincubation in the presence of 50 μM 1-68A (black diamonds) with or (black Xs) without 100 mM UDP. The fit of a first-order, decaying exponential (vi / vo = e-kt) for each data set is shown as a line.
