
Figure 5.
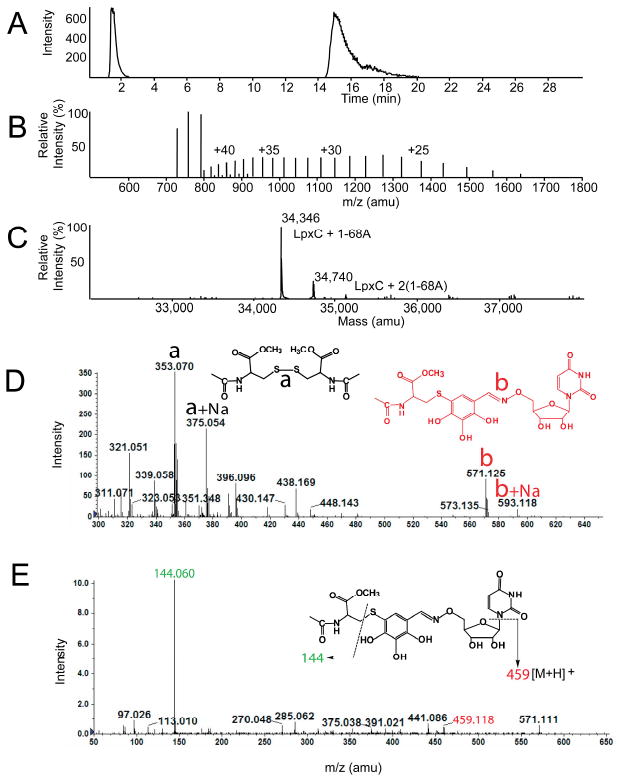
ESI-MS analysis of the E. coli LpxC – 1-68A complex. (Panel A) The LC-elution profile of E. coli LpxC preincubated with equimolar 1-68A, shown as the extracted ion current. Positive ion (Panel B) and deconvoluted (Panel C) mass spectra of E. coli LpxC from the 16-22 min region of the LC elution shown in Panel A. The observed mass of the E. coli LpxC polypeptide was 33,952 Da (data not shown). (Panel D) Mass spectrum of products formed after incubating N-acetylcysteine-methylester and 1-68A at pH 7.4. Note: The proposed structure of b, i.e. covalent complex of N-acetylcysteine-methylester and 1-68A, was proposed based on exact mass measurement and MS/MS, which would not delineate position isomers. (Panel E) MS/MS analysis of the “b” ion in Panel D.