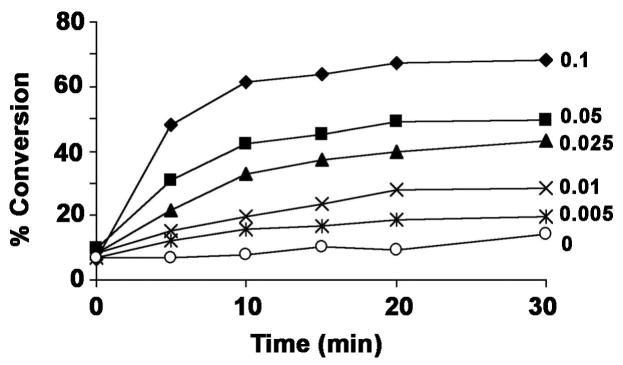
Figure 5. Dependence of LpxO product formation on time and protein concentration.
Increasing amounts of LpxO membrane protein were added to the assay cocktail, and the formation of hydroxylated lipid A was monitored with time. Membrane protein concentrations (mg/ml) in the final assay mixture are indicated. Diamonds, 0.1 mg/ml; squares, 0.05 mg/ml; triangles, 0.025 mg/ml; X, 0.01 mg/ml; stars, 0.005 mg/ml; open circles, no enzyme control. The small amount of apparent product formation at time 0 and in the no enzyme control is caused by slight streaking of the substrate band during TLC, which migrates just above the hydroxylated product band (Fig. 4B).

