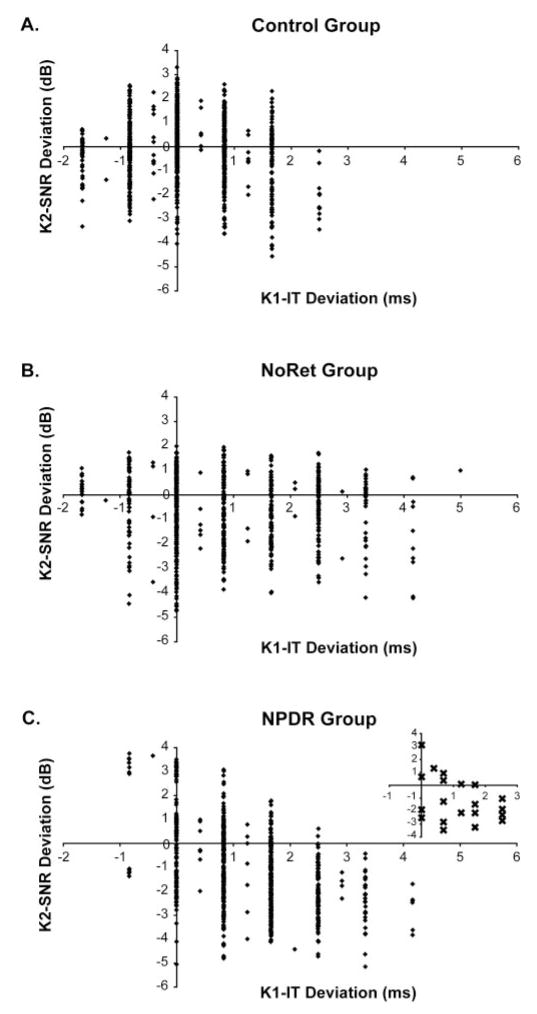
Figure 4.
Association between K2-SNR and K1-IT across subjects. (A) In the control group, K2-SNR decreased only slightly as K1-IT increased (n = 1050 zones; χ2 = 1.34; P = 0.25). (B) A similar nonsignificant trend was observed in the NoRet group (n = 700 zones; χ = 3.02; P < 0.08). (C) In contrast, reduced K2-SNR was significantly associated with longer (delayed) K1-IT in the NPDR group (n = 700 zones; χ2 = 67.46; P < 0.001). Inset: median values for each NPDR subject, illustrating the contribution to the association made by the differences among these subjects.

