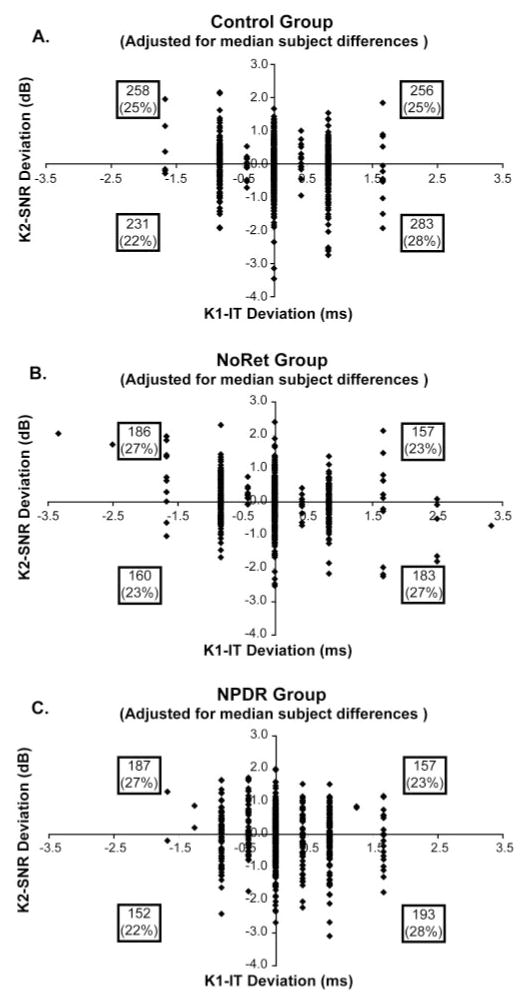
Figure 5.
Spatial association between K2-SNR and K1-IT, with median intersubject differences removed. Numbers within the boxes (one per quadrant in each graph) indicate the number of data points per quadrant, and the number in parentheses is the percentage of points in the quadrant. (A) No significant association between K2-SNR and K1-IT in the control group (n = 1028 zones; χ2 = 2.84; P > 0.05). (B) Weak association in the NoRet group (n = 686 zones; χ2 = 3.94; P = 0.05). (C) In contrast, reduced K2-SNR is still significantly associated with longer (delayed) K1-IT in the NPDR subjects (n = 689 zones; χ2 = 7.31; P < 0.01).

