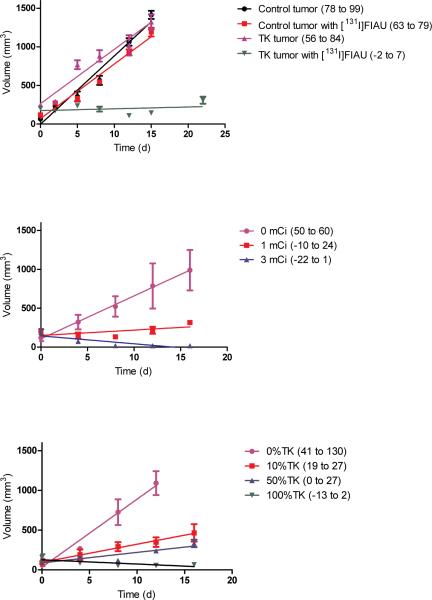
Figure 2.
Tumor growth curves. (a) Mice with control tumors (human osteosarcoma 143B cells with empty vector) or TK expressing tumors (human osteosarcoma 143B cells expressing EBV TK) were treated IV with 1.6 mCi [131I]FIAU or buffered saline. (b) Dose response. Mice with EBV-TK expressing tumors were treated with buffered saline, 1 mCi [131I]FIAU or 3 mCi [131I]FIAU. (c) Mice with tumors resulting from engraftment of admixtures of EBV-TK expressing and control tumor cells were treated with 1.7 mCi [131I]FIAU. Each time point corresponds to 3 animals. The mean, SEM, and least squares linear regression are plotted. The confidence intervals (CI, 95%) of the slopes of best fit linear regression of tumor growth curves are shown in parentheses in the legend.

