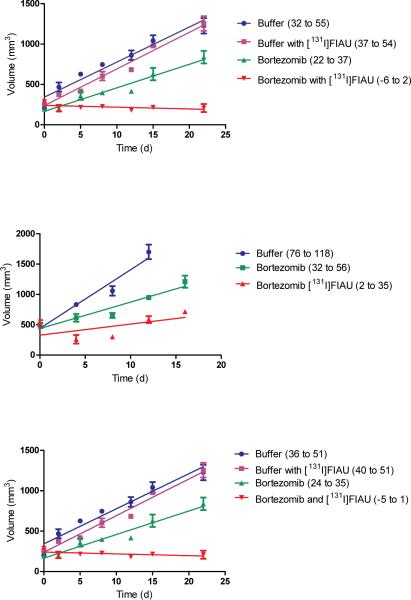
Figure 3.
Tumor growth curves in murine xenografts. (a) EBV(+) Burkitt's lymphoma (Rael), (b) EBV(+) gastric adenocarcinoma (KT), and (c) KSHV(+) primary effusion lymphoma (BCBL1) were injected intravenously with buffered saline, buffered saline followed 24 hours later by [131I]FIAU, bortezomib, or bortezomib followed 24 hours later by [131I]FIAU. Each time point corresponds to 3 animals. Mice were treated with 1.6 mCi (a,c) or 1.7 mCi (b). The mean, SEM, and least squares linear regression are plotted. The confidence intervals (CI, 95%) of the slopes of best fit linear regression of tumor growth curves are shown in parentheses in the legend.

