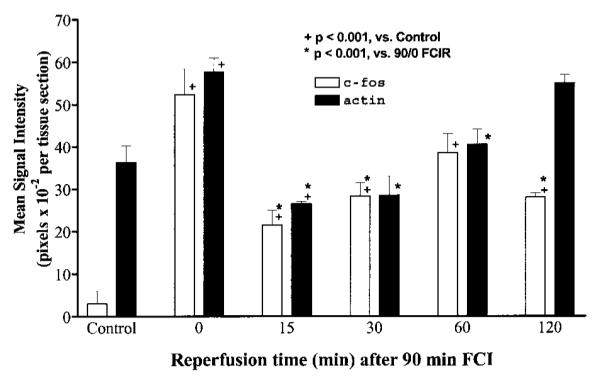
FIG. 4.

Quantification of c-fos and actin mRNA transcripts. The transcript intensity in the brain sections from the animals at each time point by ISH was measured using an image documentation system (AlphaImager; Alpha Innotech, San Leandro, CA, U.S.A.). At least two brain sections from each animal were examined in repeated ISH. Data are mean ± SEM (bars) values; the number of animals (n) was n = 3 each for control, 90/0, and 90/30 FCIR, n = 6 for 90/15 FCIR, and n = 2 for each for 90/60 and 90/120 FCIR. Figure 3 shows the typical expression of these two genes at each time point.
